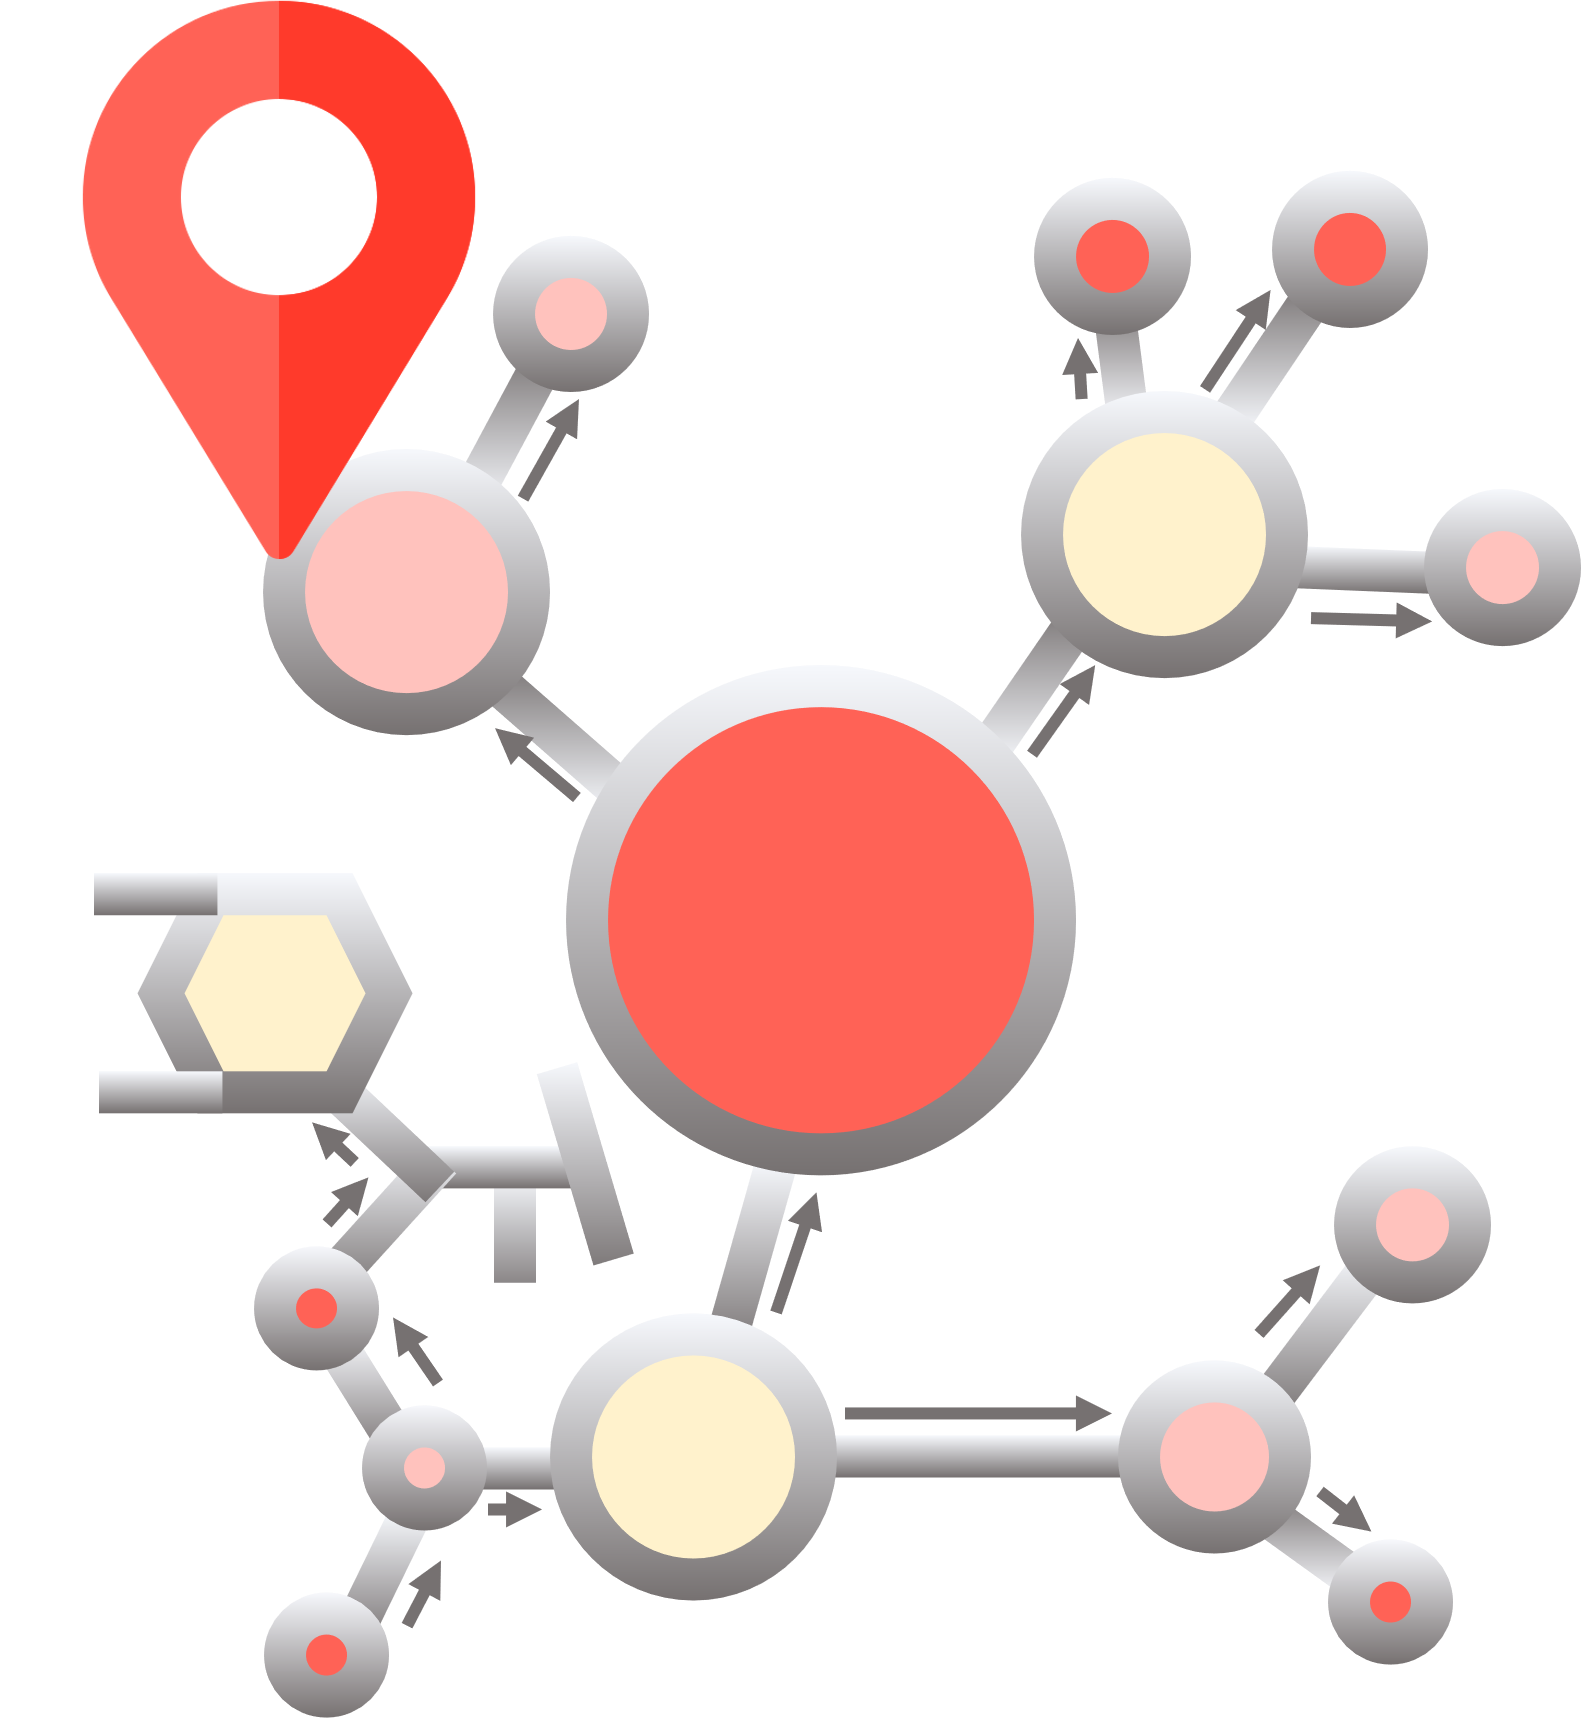
{oA.Lineage}

Mapping an Information System

Information systems are so complex that teams can no longer effectively navigate the data flows to conduct the desired investigations, whether in databases or within the data visualization tools themselves, where management rules have proliferated.

The technical and multi-technology data lineage of {openAudit} makes it possible to understand the origin and uses of each data element from end to end in on-premise and/or cloud systems with a single mouse click. The underlying analyses are rerun daily.


DataFlow mapping

Do Data Lineage in DataFlows

From any “data point” in the Information System (field, table, file, schema, etc.), {openAudit} enables understanding of its origin, lifecycle, and usage through technical, multi-technology data lineage. The process is dynamic, 100% automated, delta-based and seamless: {openAudit} handles views, nested views, dynamic procedures, FTP transfers, and more.

End-to-end impact analysis

{openAudit} offers a view that allows to instantly know all the uses of a data point in the data visualization layer, ignoring all transformations.

End-to-end impact analysis
Complete and instantaneous mapping

Complete and instantaneous mapping

{openAudit} allows you, from any data point, to display a complete map of the upstream and downstream flow, from operational sources to data exposure (DataViz, queries), i.e. its uses.

Granular data lineage

{openAudit} allows you to progressively monitor the deployment of data in complex Information Systems, on premise, Cloud, without disruption. Each transformation can be analyzed with “drill through”.

Granular data lineage

Use cases

From source to dashboard cell: Mapping the IS to rebuild it intelligently

How to prevent your information system from migrating... only to become more complex?

Do Data Lineage in the Data Visualization layer

{openAudit} combines the analyzes of the company's different DataViz technologies in the same grid, which allows the business and IT to carry out exhaustive impact analyses.

Highlighting management rules

{openAudit} performs data lineage in expressions, variables, etc., to precisely explain the management rules underlying the calculation of a dashboard indicator.

Highlighting management rules
Automatic sourcing of dashboard indicators

Automatic sourcing of dashboard indicators

{openAudit} analyzes the content of views to identify the physical fields that are the source of a dashboard's data, even if the views are stacked.

A combined impact analysis grid

{openAudit} combines the analyzes of the company's different DataViz technologies in the same grid, which allows the business and IT to carry out exhaustive impact analyses.

Combined impact analysis grid

Use cases

Power BI liberates users… But how can you maintain control of your platform over time?

From source to dashboard cell: Mapping the IS to rebuild it intelligently